
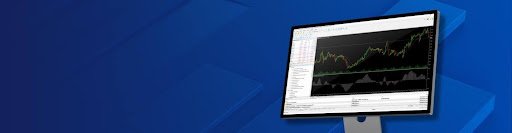
A trading dashboard should make market information easier to interpret, yet the first screen often feels crowded. Quotes change constantly, several chart windows compete for attention, and account figures sit beside tools whose purpose may not be immediately clear.
The mt5 dashboard separates market monitoring, analysis, execution, and account management into distinct sections. Understanding what each panel contributes is more useful than exploring every menu at once. The immediate goal is to follow one instrument from its live quote to its chart, order ticket, open position, and final account record.
A clean dashboard begins with knowing what can be hidden.
Market Watch and the Navigator
Market Watch displays the instruments offered through the connected broker. Bid and ask prices update in real time, allowing traders to observe both direction and the spread between buying and selling prices.
The available symbols depend on the broker and account. One account may include currencies and metals, while another provides shares, futures, and indices. Contract details such as volume limits, tick value, trading hours, and margin requirements can be accessed through the symbol specifications.
The Navigator organizes accounts, indicators, Expert Advisors, scripts, and other applications. It is the dashboard’s control cabinet. Beginners often open it only to find an indicator, while experienced users also use it to confirm the active account and manage automated tools.
Before analysing a chart, check the account and symbol.
Chart Windows and Market Depth
Charts display price across 21 available timeframes, from one minute to one month. Multiple charts can be arranged in the main workspace, but each should serve a clear purpose.
A higher timeframe can identify the dominant structure. A shorter chart can show whether price is consolidating, retesting a level, or accelerating after new information. Switching through many timeframes until one supports a preferred position usually adds confidence without adding evidence.
Market Depth shows bids and offers at different levels when that information is provided by the broker or exchange. It can help traders observe nearby liquidity and submit orders from the depth window.
Visible orders can change rapidly.
That limitation matters during volatile conditions. On August 5, 2024, the yen strengthened sharply as carry trades unwound and global equity markets sold off. USD/JPY moved quickly, while liquidity conditions changed as positions were reduced. A depth display might have shown available orders, but it could not guarantee that those orders would remain when price reached them.
The dashboard provided a view of the movement. It did not remove execution risk.
The Toolbox and Account Exposure
The Toolbox contains several tabs covering open positions, account history, news, alerts, economic-calendar information, messages, and platform logs. For beginners, the Trade tab is the most important place to understand first.
Balance shows completed account results. Equity includes the current effect of open positions. Margin represents funds supporting those positions, while free margin shows what remains available for further movement or new exposure.
A trader can have an unchanged balance and rapidly declining equity.
This difference is easy to overlook when attention stays fixed on the chart. Experienced traders keep account exposure visible because a technically interesting move matters less if the position is already too large.
The History tab records completed trades, commissions, financing charges, and other account activity. The Journal and Experts tabs provide technical records that can help investigate failed orders, connection problems, or automated-strategy activity.
Orders, Alerts, and Workspace Control
The platform supports market orders, six pending order types, stop-loss instructions, take-profit levels, and trailing stops. The order ticket brings together symbol, volume, order type, price, and exit conditions.
Order size deserves attention before the buy or sell button is pressed. The required margin does not represent the maximum possible loss. Position size should be calculated from the distance to invalidation and the amount of account currency placed at risk.
Alerts can notify traders when price reaches a specified level. This reduces the need to monitor each tick and can prevent early entries caused by boredom. Economic-calendar events can also be reviewed before exposure is opened.
Counterintuitively, the most efficient dashboard is rarely the one showing the most information. Hiding unused symbols, reducing the number of charts, and closing redundant indicators can improve reaction time because unusual conditions become easier to notice.
For a practical first session with mt5, keep Market Watch, Navigator, one chart, and the Toolbox visible. Choose one liquid instrument, inspect its specifications, mark two important price levels, create an alert, and place a small demo order with a stop and target. Then follow that position through the Trade, History, and Journal tabs. The exercise connects every major dashboard area to one complete transaction.